Brooks Cascadia Elite vs KIPRUN Kipsummit Max
Last updated 2026-10-28 · the comparison recomputes itself when either shoe’s data changes
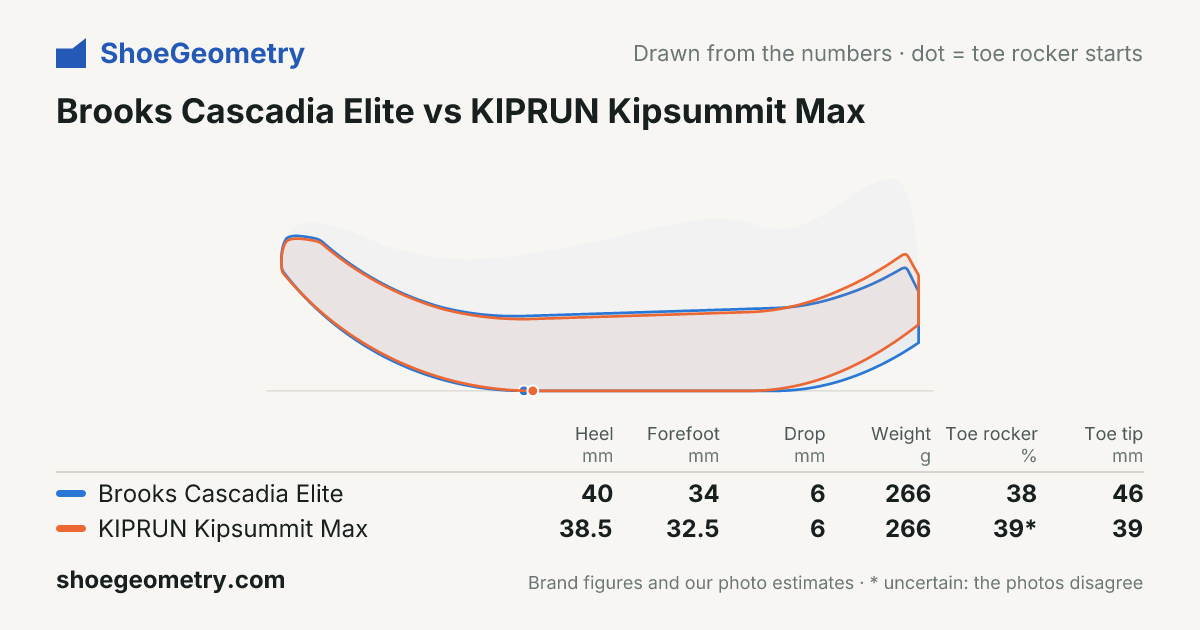
Two popular shoes in the same category, compared on measured geometry. Each cell carries a provenance badge; open a shoe for sources.
- Brooks Cascadia Elite40/34 mm · toe rocker 38 % · heel bevel 12 %
- KIPRUN Kipsummit Max39/33 mm · toe rocker 39 % · heel bevel 16 %
Which suits you
| If you want | Pick | Because |
|---|---|---|
| A smoother roll at toe-off | Brooks Cascadia Elite | 38.1 vs 39.5 % toe rocker; 46.4 vs 38.6 mm toe tip |
| More cushioning under the heel | About the same | 40 vs 38.5 mm heel stack |
| More under the forefoot | About the same | 34 vs 32.5 mm forefoot stack |
| A lower drop | About the same | 6 vs 6 mm drop |
| A stiffer, snappier forefoot | About the same | 39 vs 31 /100 stiffness |
| A firmer, more stable feel | KIPRUN Kipsummit Max | 23 vs 90 /100 firmness |
| A wider base under the forefoot | About the same | 116.9 vs 117.6 mm forefoot base |
From the values below, with differences inside measurement noise shown as about the same. This describes the shoes, not what is right for your feet; comfort in the first few runs decides.
| Metric | Brooks Cascadia Elite Trail · Trail | KIPRUN Kipsummit Max Trail · Trail |
|---|---|---|
| Heel-to-toe drop | 6 mmDerived | 6 mmStated |
| Heel-to-toe drop (lab) | 11.5 mmMeasured | 8.1 mmMeasured |
| Heel stack | 40 mmStated | 38.5 mmStated |
| Heel stack (lab) | 38.8 mmMeasured | 35.5 mmMeasured |
| Forefoot stack | 34 mmStated | 32.5 mmStated |
| Forefoot stack (lab) | 27.3 mmMeasured | 27.4 mmMeasured |
| Weight | 266 gStated | 266 gStated |
| Toe rocker | 38 %est. | 39 %*est. |
| Rocker radius | 47 %est. | 51 %est. |
| Rocker rise angle | 28 degest. | 24 deg*est. |
| Rocker angle at toe | 59 degest. | 55 degest. |
| Toe tip over ground | 46 mmest. | 39 mmest. |
| Visible rocker lift onset | 73.9 %est. | 70.7 %est. |
| Toe spring (relative) | 20.8 %est. | 17.8 %est. |
| Heel bevel length | 12.4 %est. | 16.5 %*est. |
| Heel bevel height | 19 mm*est. | 27 mm*est. |
| Midsole width (forefoot) | 116.9 mmMeasured | 117.6 mmMeasured |
| Midsole width (heel) | 100.9 mmMeasured | 96.6 mmMeasured |
| Toe box shape | 79 %est. | — |
| Interior forefoot width | 92.6 mmMeasured | 93.3 mmMeasured |
| Toebox width | 71.6 mmMeasured | 69 mmMeasured |
| Longitudinal stiffness | 39Derived | 31Derived |
| Midsole firmness | 23Derived | 90Derived |
| Plate | Carbon composite | No plate |
| Primary foam | DNA Gold (PEBA) | FASTECH+ (supercritical A-TPU) |
| List price | $275 | $150 |
Key differences
- Heel-to-toe drop is about the same: 6 mm for Brooks Cascadia Elite, 6 mm for KIPRUN Kipsummit Max.
- Brooks Cascadia Elite's heel stack is 40 mm, 1.5 mm thicker than KIPRUN Kipsummit Max's 38.5 mm.
- Brooks Cascadia Elite's forefoot stack is 34 mm, 1.5 mm thicker than KIPRUN Kipsummit Max's 32.5 mm.
- Weight is about the same: 266 g for Brooks Cascadia Elite, 266 g for KIPRUN Kipsummit Max.
- Toe rocker is about the same: 38 % of length for Brooks Cascadia Elite, 39 % of length for KIPRUN Kipsummit Max.
More comparisons
#4 of the 7 best trail running shoes
On the shortlist in: Super shoes
Read more about both shoes
We measure the shape. For how they feel over many miles, and for lab tests of cushioning, grip and fit:
Brooks Cascadia Elite
- Believe in the Run · tester review
- RunRepeat · lab test
KIPRUN Kipsummit Max
- Believe in the Run · tester review
- RunRepeat · lab test
Independent sites; we are not affiliated with them.
Share or embed
Embed on your site, blog or forum
Image with a link back:
<a href="https://shoegeometry.com/compare/brooks-cascadia-elite-vs-kiprun-kipsummit-max"><img src="https://shoegeometry.com/compare/brooks-cascadia-elite-vs-kiprun-kipsummit-max/share.png" alt="Brooks Cascadia Elite vs KIPRUN Kipsummit Max: running-shoe geometry (ShoeGeometry)" width="600" height="315" style="max-width:100%;height:auto"></a>
Live embed (updates when we measure more):
<iframe src="https://shoegeometry.com/embed/compare/brooks-cascadia-elite-vs-kiprun-kipsummit-max" title="Brooks Cascadia Elite vs KIPRUN Kipsummit Max (ShoeGeometry)" width="100%" height="580" style="border:0;max-width:640px" loading="lazy"></iframe> <p><a href="https://shoegeometry.com/compare/brooks-cascadia-elite-vs-kiprun-kipsummit-max">Brooks Cascadia Elite vs KIPRUN Kipsummit Max</a>: running-shoe geometry from ShoeGeometry</p>
Free to use with the link back (CC BY 4.0). Lab measurements are credited to the lab that made them.